
Is WordPress slow? 100/100 in Lighthouse and 3/3 in agentic browsing
Our old site ran on WordPress and Elementor. Building the new one, we set out to cut weight and requests without giving up design or content. Today: 7 requests, around 68 KB, 100 across the four Lighthouse audits and 3/3 in agentic browsing. And what we cannot measure, we say so too.
For quite a while our website ran on WordPress and Elementor.
There is nothing particularly odd about that. Millions of sites work this way and WordPress can carry excellent projects. The problem appears when, over the years, a site starts accumulating layers: the page builder, plugins, styles, scripts, features added to solve one specific need, and resources that keep loading long after everyone has forgotten why they were there.
At some point, opening a page starts to feel like packing a suitcase you haven't emptied in ten years.
Everything looks necessary until you have to lift it.
When we built the new Sakudarte site we decided to approach the problem from somewhere else. We didn't want to finish the design and then ask how to make it faster. We wanted performance to be part of the development decisions from the start.
What we measure today on the home page is fairly concrete: 7 requests and around 68 KB transferred on a first visit.
On top of that, 100 points across the four Lighthouse/PageSpeed categories —Performance, Accessibility, Best Practices and SEO— on both mobile and desktop, and 3/3 in its new agentic browsing audit.
But before celebrating the numbers too much, there is something worth saying.
We do not have an equivalent measurement of the old site taken under the same conditions.
So this is not a «we used to weigh X and now we weigh Y» article.
We are not going to invent the before to make the after look more impressive.
What is interesting is something else: what happens when you stop trying to optimise a site built by accumulation and start developing with a clear question in mind — how much does a page actually need to load in order to do its job?
Was WordPress the problem?
It would be tempting to say yes, but it wouldn't be entirely true.
WordPress doesn't have to be slow. What happens is that its flexibility makes it very easy to add layers to a project.
A page builder brings its own resources. A plugin adds more. A feature needs a library. The next plugin loads something else. A theme includes components you might use on one page out of twenty, but whose styles or scripts end up travelling far more widely than necessary.
None of that is usually a disaster on its own.
The problem is the sum.
In our case, the previous site used WordPress and Elementor. We did not keep a rigorous measurement of weight, request count or LCP that would let us claim the change delivered a specific percentage improvement, and we would rather say so plainly.
What we do know is how the new one is built and how much it needs today.
And seven requests leave very little room to hide unnecessary resources.
The goal wasn't to score 100, it was to need fewer things
When we talk about web optimisation it is easy to turn PageSpeed into a video game: 97, 98, 99, we tweak something again, 100, and for a few seconds we feel like we have completed the internet.
We set out to reach that 100 too, but the exercise was useful mainly because it forced us to justify every decision technically.
Do we need to load this resource? Does this dependency make sense? Does this feature add enough value to pay its cost? Can we get the same result with something simpler?
The difference matters.
A fast page doesn't necessarily appear because someone installs a caching plugin at the end of a project, ticks four boxes and compresses the images.
Performance is decided much earlier.
It is decided in the architecture, in the number of dependencies we accept, in how we build components and in how much code we force the browser to receive, parse and execute in order to show something that was probably quite simple.
That is why the seven-request figure interests us almost as much as the score.
There are very few conversations happening before the page can do its job.
What we can demonstrate today: 68 KB, 7 requests and 100 in Lighthouse
It is worth being precise with the figure, because it is easy to publish one that doesn't add up when somebody checks it.
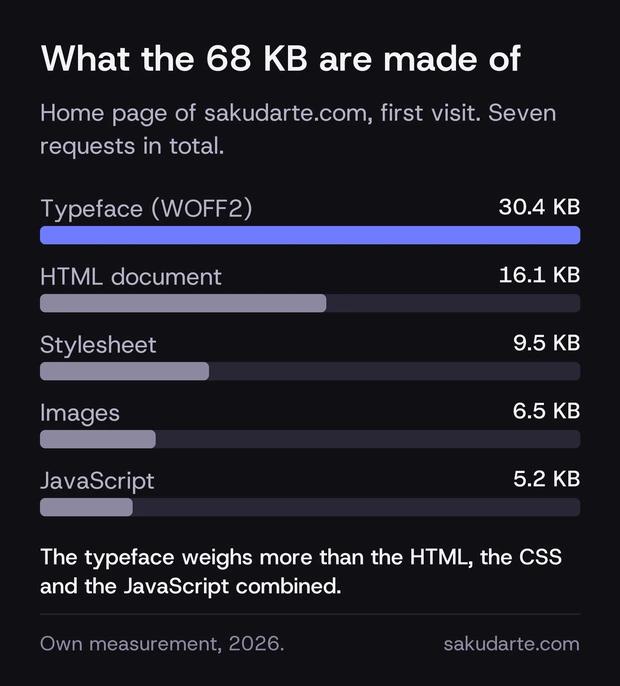
In the measurement we used for this article, the home page needs seven requests: the HTML document itself plus six subresources —the stylesheet, the typeface, the layout script, the logo, an icon and an arrow—.
This is the breakdown:
- HTML document: 16.1 KB compressed. Uncompressed it is 68.5 KB, so gzip removes 76 % of the weight.
- Typeface (WOFF2): 30.4 KB. It is the heaviest resource on the page, and it is a variable font carrying its full weight range.
- Stylesheet: 9.5 KB compressed, for the entire site.
- JavaScript: 5.2 KB.
- Images: 6.5 KB across logo, icon and arrow, all vector except the favicon.
Total: around 68 KB on a first visit.
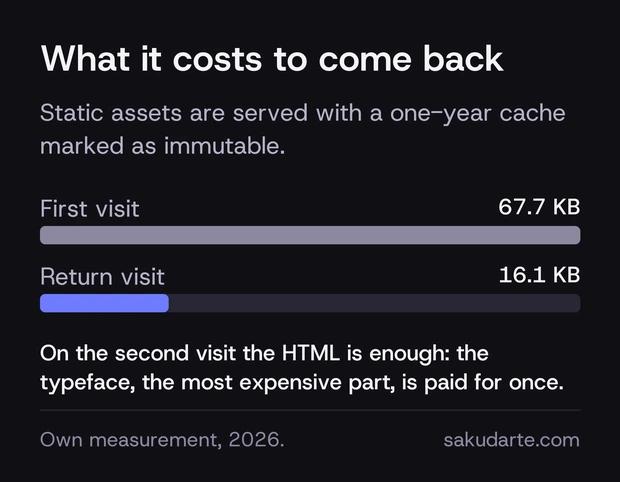
And there is a second figure we like even more. Static assets are served with a one-year cache marked as immutable, so on a return visit the browser essentially only needs the HTML: about 16 KB. The typeface, the most expensive part of the page, is paid for once.
The home page also scores 100 in Performance, Accessibility, Best Practices and SEO in the Lighthouse/PageSpeed audits, on mobile and desktop.

The important phrase here is «lab data».
PageSpeed Insights combines two kinds of information that shouldn't be mixed. On one hand there are Lighthouse's synthetic tests, run under controlled conditions: very useful for spotting technical problems, comparing changes and understanding how a page behaves in a given scenario. On the other there is field data from the Chrome UX Report, CrUX, which comes from real Chrome users over a period of time.
Our site does not yet have enough real-user volume for CrUX to show field metrics.
If you open PageSpeed Insights today and find the «No data» message, that is why.
It doesn't mean the site can't be measured, or that the 100 mysteriously disappears. It means there aren't yet enough real, anonymous, representative samples for Google to publish field data for that URL or origin.
We thought it was important to explain, precisely because we are talking about measurement.
It would make little sense to ask for rigour with data and hide the data we don't have yet.
A lab score of 100 doesn't mean every user gets 100
This nuance is worth keeping too.
Lab tests are repeatable and comparable, but a real person may visit a page from a different phone, on a worse connection, while the device is busy with other processes, or in conditions a synthetic test doesn't reproduce exactly.
So when our site accumulates enough traffic to have representative CrUX data, there will be a second and far more interesting layer of information: we will be able to compare what we designed and measured in the lab with what users actually experience.
Until then, our claim is more modest and also more precise: we have built a site that scores top marks in the lab audits we use and that moves a very small amount of information to present the page we measured.
That much we can measure today.
Why does reducing weight and requests matter so much?
Because every resource has a cost.
The browser has to request it, receive it and, depending on the file type, process or execute it.
A heavy site can work perfectly well in certain circumstances, but as we add dependencies we also increase the chances of introducing waits, blocking, errors or behaviour that is hard to control.
This doesn't mean every project should aim for our 68 KB.
An ecommerce site, an application, an industrial configurator or a platform with 3D visualisation have very different needs.
The point is not to set a universal figure.
The question is whether the weight and complexity we are adding are justified by what they give the user.
On our new site we wanted design, photography, content and a recognisable visual experience. We didn't want to achieve speed by turning it into an almost empty page.
The challenge was precisely to show that performance and design don't have to sit at opposite ends of the table. It is the same idea we apply in B2B web design projects: architecture, content and performance are decided together, not in separate phases.
Agentic browsing: what it checks, and why we pass it
Here is something that didn't exist when we first published this article in 2019.
Lighthouse added a new category called Agentic Browsing in version 13.3, and enabled it through the PageSpeed API in 13.4. Unlike the classic 0-to-100 scores, PageSpeed shows it as a set of passed checks.
On our site the current result is 3/3. And what is interesting isn't the number but what each check looks at, because all three are the consequence of specific decisions:
- The accessibility tree is well formed. A well-formed tree helps AI agents navigate a page and interact with it. In our case it comes from working on HTML semantics: a single h1 per page, a heading hierarchy with no skipped levels, and alternative text on every image. We did it for accessibility, not for agents.
- Cumulative Layout Shift: 0. CLS measures the movement of visible elements while a page loads. An exact zero means nothing jumps around, and that matters equally to a person about to click a button and to an agent trying to locate an element.
- The llms.txt file follows the recommendations. It has to be a Markdown file with at least one H1 heading, so a large language model can interpret how you want your site to be crawled and used.
Of the three, the llms.txt one gave us the most to think about.
We published that file on 3 July 2026, when we set up the schema and the URL structure of the new site. No audit existed to check it: we added it because it seemed the reasonable thing to do if we wanted AI tools to understand who we are and what we do.
The audit came later.
And that is exactly this article's argument, extended to agents: you don't prepare a site for agents on the day the tool that measures them appears. You prepare it earlier, by making defensible decisions, and then the tool finds you ready.
That said, we don't want to turn the 3/3 into another magic number.
It doesn't mean ChatGPT will cite us more, that Gemini will place us ahead of a competitor, or that a page will rank better in Google. It means a specific technical audit now exists for certain aspects of agent navigation, and that our site currently passes the three checks PageSpeed shows in that category.
That is measurable. And anyone can run the test again.
From SEO to a site machines will also have to understand
This section was much longer in the first version of this article and we decided to cut it for a simple reason: we already cover how SEO, artificial intelligence and supplier discovery are changing, in far more depth, in our article on how an industrial website should work.
Here we only care about the technical consequence.
For years we developed with essentially two audiences in mind: people and search engines.
Now there is a third entering the equation.
AI systems and agents also need to access content, interpret structures and understand what they can do inside a page.
That doesn't make previous good practice obsolete. If anything it makes some of it more valuable: understandable HTML, semantics, accessibility, visual stability, available content, and an architecture that doesn't depend on a mountain of unnecessary execution to make sense of what is there.
The 3/3 in agentic browsing doesn't prove we have «won AI». It proves something far more concrete and, therefore, far more useful.
All of this is the technical side, the part you do once and that holds. The ongoing positioning work for companies selling to companies we cover under B2B SEO.
So do you have to leave WordPress to have a fast site?
No.
That would be a fairly poor conclusion.
There are extraordinarily fast sites built on WordPress and desperately slow ones built with much more modern technology.
The tool matters, but the decisions matter more.
There are projects for which WordPress remains an excellent option. There are also cases where a page builder gives an editing autonomy that more than compensates for part of its technical cost.
The question arises when that architecture stops serving the project's priorities.
In our case we decided to change it. Not because we wanted to prove Elementor was the villain of the story, but because the new site let us rethink from scratch what we needed to load and what we could leave out.
So we wouldn't present the fix for a slow WordPress as a universal recipe either.
Sometimes the problem is enormous images. Other times, the hosting. It can be a theme, plugins, third-party JavaScript, fonts, widgets, ad tags or a combination of twenty apparently small decisions.
Some sites need optimisation.
And there are others where, at some point, it makes more sense to revisit the architecture.
The difference only becomes clear after measuring.
What we don't want to do again
This is perhaps the main conclusion the project leaves us with.
We don't want to treat performance again as the phase that arrives after a site is finished.
First we design. Then we develop. And at the end we optimise.
That sequence invites us to see speed as a technical correction, when a page's weight is often the accumulated consequence of every decision that came before.
On the new site we have tried to invert that logic.
Every time we add something, we also ask what it costs. Not only in design or development hours: what it costs the browser, what it adds to the request, what dependency it introduces, and whether it really deserves to be there.
The visible result is 68 KB across seven requests, scores of 100 in the lab audits we use, and 3/3 in agentic browsing.
Later on we will have real CrUX data and be able to add another perspective. Today we don't have it, and saying so is part of the case.
We also don't know precisely how much that old WordPress and Elementor site weighed under exactly the same conditions. That is part of the case too.
Because perhaps the most interesting lesson isn't how much we improved against an old figure we didn't keep.
It is knowing that we can now explain, with reasonable precision, what our site is loading and why.
The 100 looks great in PageSpeed.
The 68 KB tell a considerably more interesting story.
Sources
- PageSpeed Insights, the tool anyone can use to repeat these measurements
- Lighthouse release notes: 13.3 adds the agentic browsing category and 13.4 enables it in the PageSpeed API
- Chrome UX Report (CrUX): where field data comes from, and why a URL without enough samples doesn't have it
- Core Web Vitals: what LCP, INP and CLS measure, and their thresholds
- The llms.txt specification
This article is part of our B2B web design.